Vector Projection
Vector projection is the process of projecting one vector onto another. In simple terms, it is the adjacent side of a right triangle with the original vector as the hypotenuse.
🖖
If you like the way I explain stuff, follow me on bluesky - @nishtahir.com or mastodon - @nish@social.nishtahir.com.
Vector projection is the process of projecting one vector onto another. In simple terms, it is the adjacent side of a right triangle with the original vector as the hypotenuse.
The projection of vector \( u \) onto vector \( v \) is given by:
\[ v_u = \frac{v \cdot u} { || u || ^ 2 } u \]
where \( v \cdot u \) is the dot product of \( v \) and \( u \), and \( || u || ^ 2 \) is the squared magnitude (norm) of \( u \).
in code,
def norm(v: list[float]) -> float:
    return math.sqrt(sum(v[i] ** 2 for i in range(len(v))))

def dot_product(v: list[float], u: list[float]) -> float:
    return sum(v[i] * u[i] for i in range(len(v)))

def projection(v: list[float], u: list[float]) -> list[float]:
    return [dot_product(v, u) / (norm(u) ** 2) * u[i] for i in range(len(u))]


u = [1, 3]
v = [4, 2]

u_v  = projection(u, v)
print(u_v) # [1.9999999999999996, 0.9999999999999998]
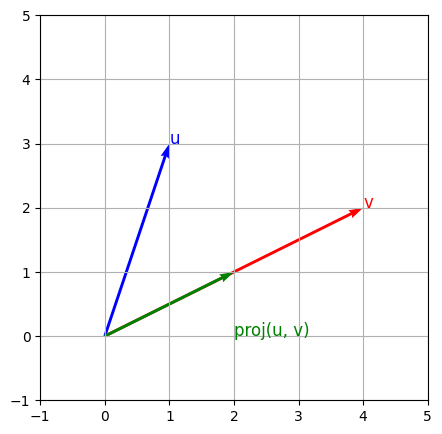
We can visualize this by plotting the vectors:
import matplotlib.pyplot as pltplt.figure(figsize=(5, 5))

plt.quiver(0, 0, v[0], v[1], color="red", scale_units="xy", angles="xy", scale=1)
plt.quiver(0, 0, u[0], u[1], color="blue", scale_units="xy", angles="xy", scale=1)
plt.quiver(0, 0, v_u[0], v_u[1], color="green", scale_units="xy", angles="xy", scale=1)

# labels
plt.text(v[0], v[1], "v", fontsize=12, color="red")
plt.text(u[0], u[1], "u", fontsize=12, color="blue")
plt.text(v_u[0], v_u[1] - 1, "proj(u, v)", fontsize=12, color="green")
plt.xlim(-1, 5)
plt.ylim(-1, 5)
plt.grid(True)
plt.show()