Adding Gaussian Noise to a signal in Python
Gaussian noise is data that is added to a signal in order to introduce a distortion. The data follows a Gaussian/Normal distribution. It's a well understood distribution often used to introduce noise to training data as an augmentation technique.
Generating noise to add to a signal is pretty straight forward using numpy.
x = np.arange(0, 10, 0.1)
y = np.sin(x)

mean = 0
std_dev = 0.2
size = len(y)
noise = np.random.normal(mean, std_dev, size)
Plotting this yields a nice visualization
plt.plot(x, y, color='green')
plt.plot(x, y + noise, color='red', alpha=0.5)
plt.legend(["sin(x)", "sin(x) + noise"])
plt.title("Sin(x) with Gaussian Noise. T=1")
plt.show()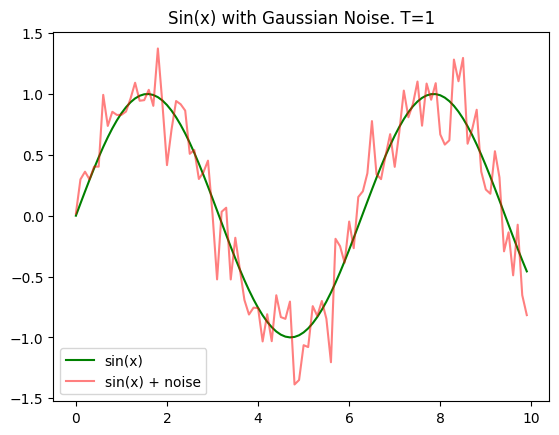
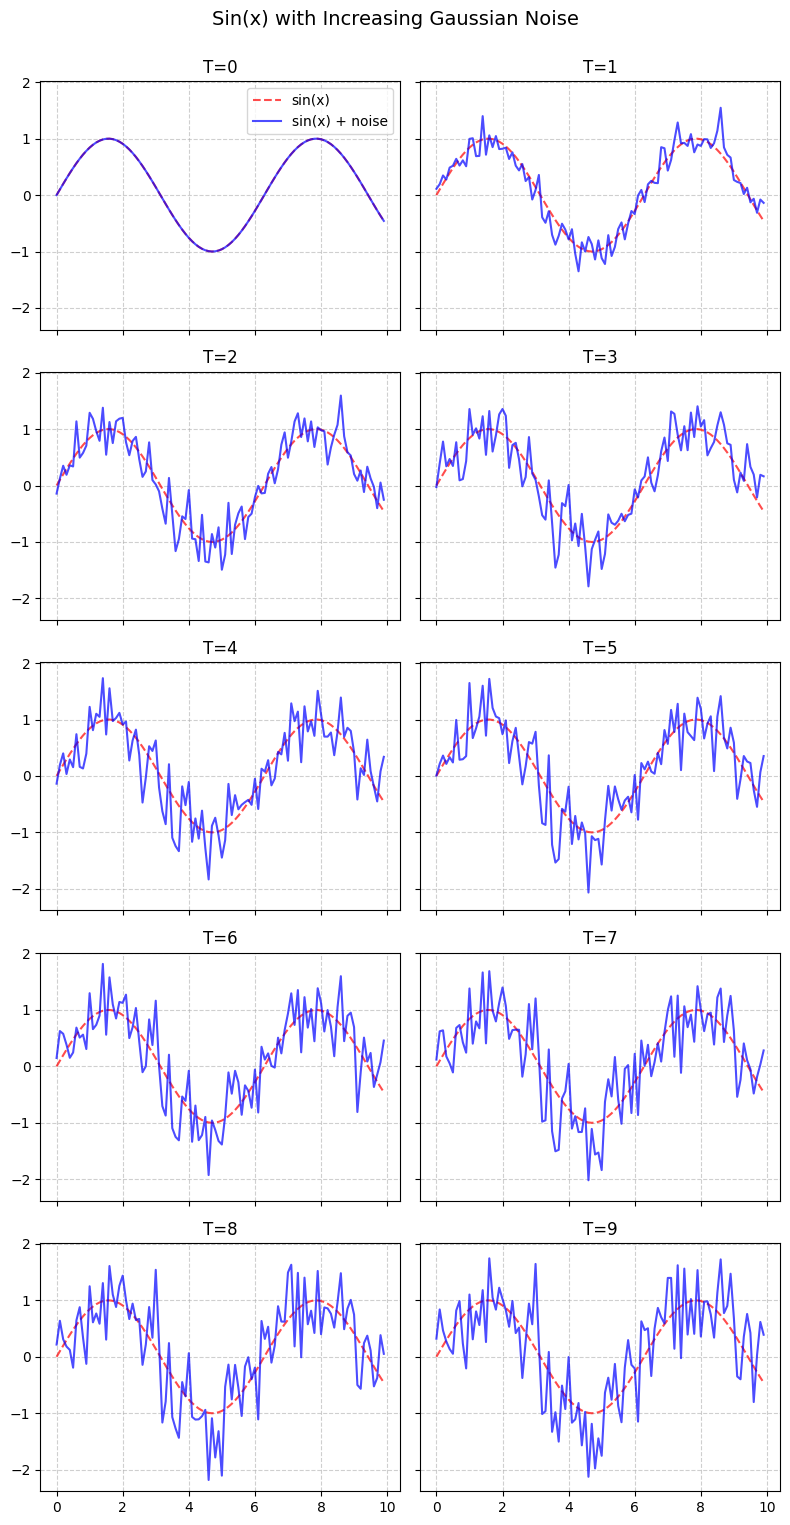
Progressively adding more and more noise over in multiple iterations creates an increasingly distorted signal.
num_time_steps = 10

x = np.arange(0, 10, 0.1)
y = np.sin(x)
y_values = [y]

for i in range(num_time_steps):
    y_i = y_values[i]

    mean = 0
    std_dev = 0.2
    size = len(y_i)
    noise = np.random.normal(0, std_dev, len(y_i))
    y_values.append(y_i + noise) # i + 1

n_rows = 5
n_cols = 2

fig, axes = plt.subplots(n_rows, n_cols, figsize=(8, 16), sharex=True, sharey=True)
axes = axes.flatten()

for i in range(num_time_steps):
    y_noisy = y_values[i]
    ax = axes[i]
    ax.plot(x, y, color='red', linestyle='--', alpha=0.7, label="sin(x)")
    ax.plot(x, y_noisy, color='blue', alpha=0.7, label="sin(x) + noise")
    ax.set_title(f"T={i}")
    ax.grid(True, linestyle='--', alpha=0.6)

    if i == 0:
        ax.legend()

fig.suptitle("Sin(x) with Increasing Gaussian Noise", fontsize=14)
plt.tight_layout(rect=[0, 0.03, 1, 0.98])
plt.show()